
Website: https://fayesong-0223.github.io/gamfluence/ · Tutorial: Which sites change a GAM, and why? A coral trout example
Which sites change your GAM when you leave them out, and how much of that change comes from the smoothing parameters re-tuning?
gamfluence answers this for penalised additive (mixed) models fitted with mgcv::gam(). mgcv itself has no deletion diagnostics: influence.gam() only returns leverages.
For each site (cluster), the model is refitted without it, twice:
- fixed: the estimated smoothing parameters (and negative binomial θ) are held at their full-data values. This is what a classical deletion diagnostic sees.
- re-estimated: they are re-estimated without the site.
Comparing the two shows influence that runs through the smoothing parameters. For a random-effect term, the smoothing parameter sets the estimated between-site variance, so a site with an extreme level can change how strongly every other site is shrunk. A fixed-parameter diagnostic cannot see that.
Example
library(mgcv)
library(gamfluence)
set.seed(1)
d <- data.frame(site = factor(rep(1:12, each = 6)), x = runif(72))
d$y <- sin(2 * pi * d$x) + rnorm(12, 0, 0.4)[d$site] + rnorm(72, 0, 0.5)
m <- gam(y ~ s(x) + s(site, bs = "re"), data = d, method = "REML")

infl <- gam_influence(m, cluster = "site")
infl                          # largest changes, and which hyperparameters moved
top_units(infl, by = "added")
plot(infl, n = 3)             # fixed against added, one point per site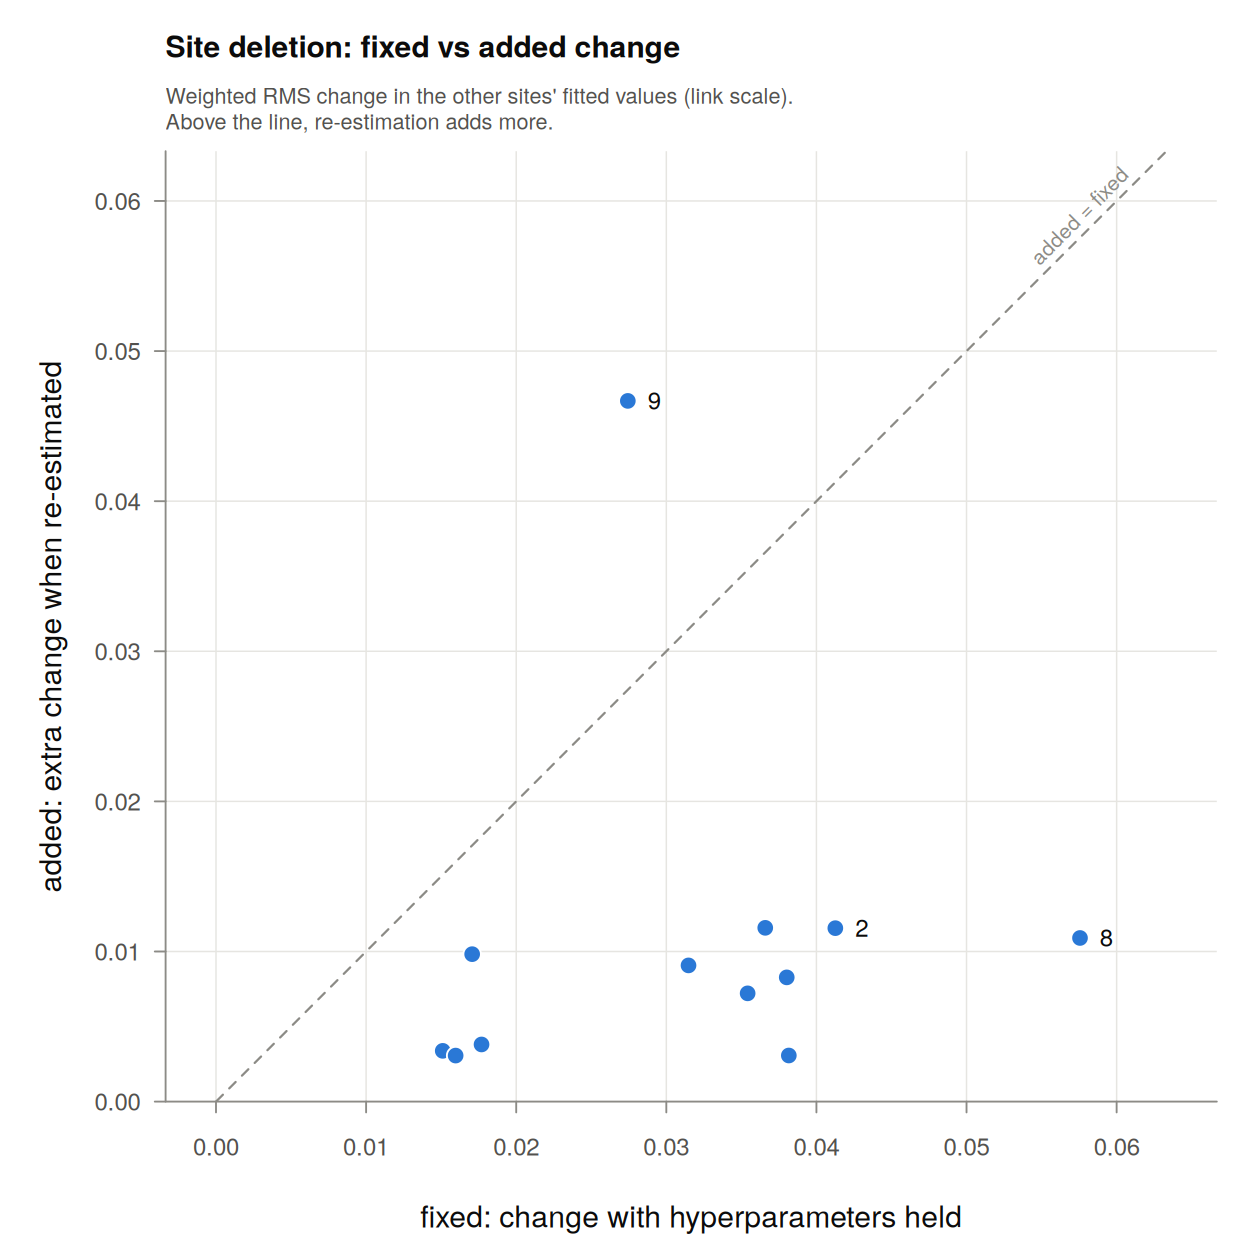
Sites above the dashed line change the fit more through the smoothing parameters re-tuning than through the held-parameter refit. Here site 9 stands out: re-estimating the smoothing parameters adds more than the held-parameter refit shows.
infl$sites has one row per site:
| column | meaning |
|---|---|
fixed |
change in the other sites’ fitted values, smoothing parameters held |
added |
what re-estimating them adds |
total |
change when everything is re-estimated |
status, note
|
ok, or what happened (rank deficiency, a held smoothing parameter, two REML optima, non-convergence) |
For every fitted value, fixed + added = total exactly. The table shows RMS summaries of those changes, and RMS values do not add. total is never larger than fixed + added, and equals it only when one change is a non-negative multiple of the other. A smaller total only means the two changes are not perfectly aligned. On its own it does not mean re-estimation offsets the fixed change; offsetting shows up as total² < fixed² + added².
infl$hyper gives each hyperparameter’s full-data value, its value without the site, and their ratio. Random-effect terms are shown as standard deviations. A very large smoothing-parameter ratio means the smooth became close to a straight line; the exact number is then not meaningful.
Two optima. The REML score can have more than one optimum, often a curved fit and a nearly straight one. So the re-estimated refit is searched for twice, from mgcv’s default starting values and from the full-data values, and the fit with the better REML score is used. When the two searches end at clearly different fits, status says two optima and note gives the other fit’s total and how much worse its REML score was. A small difference means the data barely prefer one fit, so read that site’s added and total with care.
Units. Changes are weighted RMS changes in the linear predictor. The weights are the fit’s IRLS weights, so rows with more information count more.
On a log link, a change of d multiplies a prediction by exp(d): a relative change of exp(d) − 1. When the individual log changes are small, exp(d) − 1 ≈ d. So an RMS of 0.02 approximates a weighted RMS relative change of about 2% in the other sites’ predicted means. The approximation fails for large individual changes (d = 0.2 is +22%, d = −0.2 is −18%), and a small RMS can still hide a few large changes.
There is no null reference, so compare sites with each other.
A real example: coral trout on the Great Barrier Reef
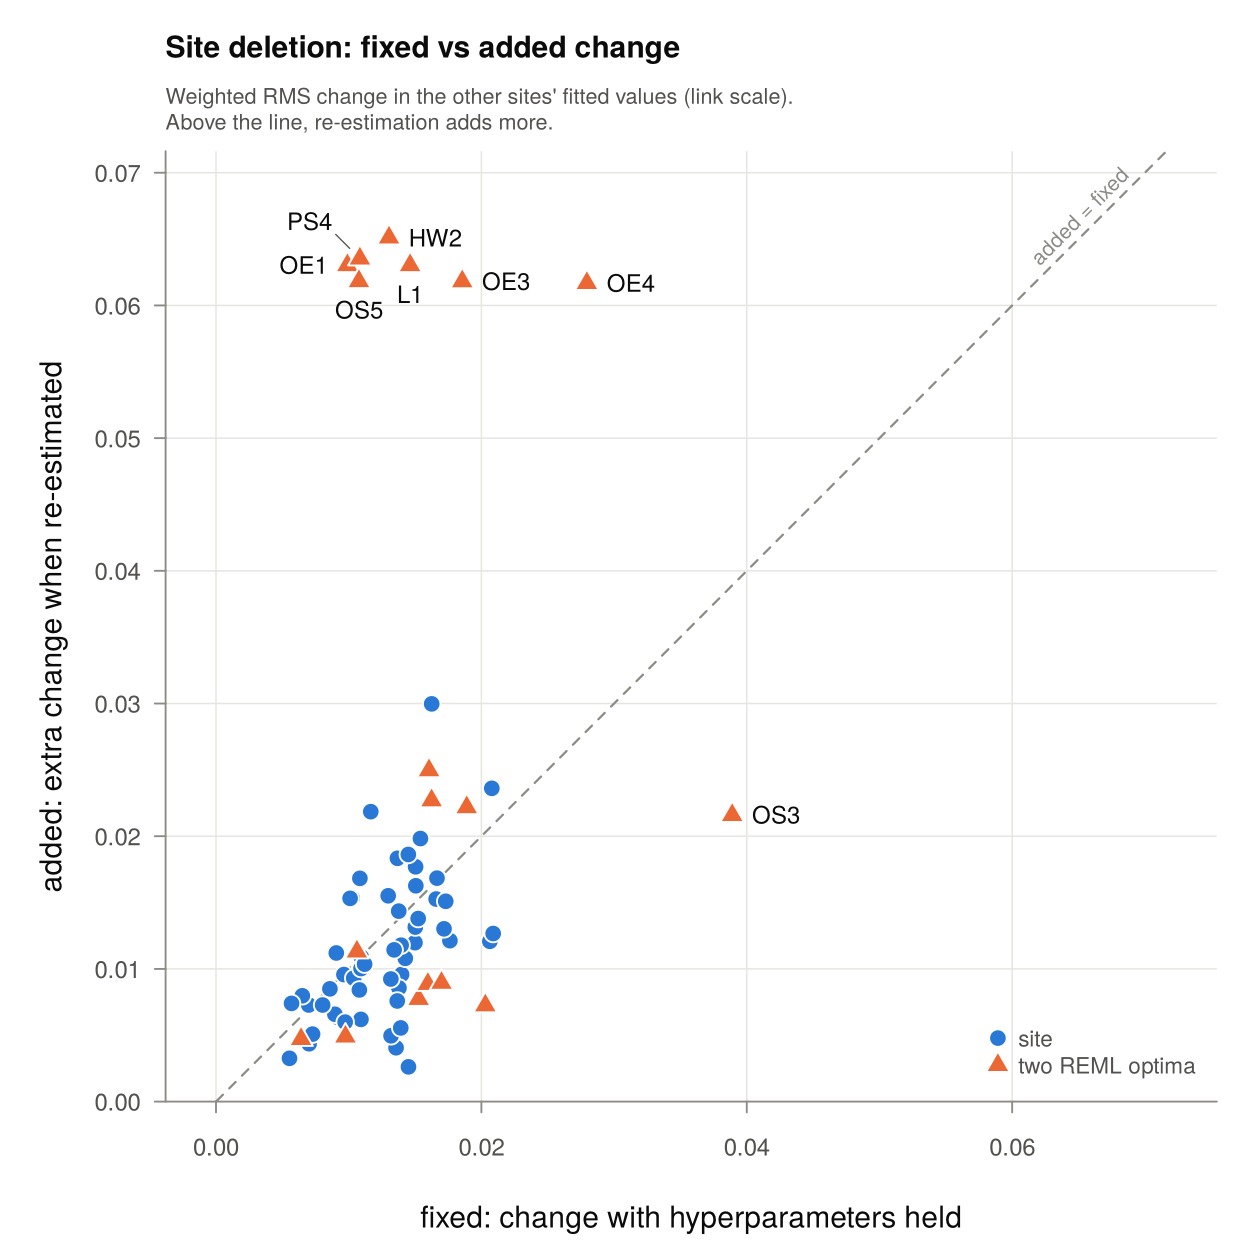
The package ships coral_trout, 467 surveys of coral trout at 71 inshore reef sites, and the vignette runs a negative binomial GAM on it. Seven sites look ordinary when the smoothing parameters are held: their fixed changes sit inside the range of the other sites. But removing any one of them lets REML straighten the Palm year trend, and the extra change from re-estimation is 2 to 6 times the held-parameter change. A classical, fixed-parameter diagnostic would not flag them. The tutorial walks through why.
Scope
Supported:
-
gam(..., method = "REML")with the default optimizer; - families:
- one-dimensional
s()with the default thin-plate basis,s(g, bs = "re")withga factor, andby = factor; - offsets, prior weights, user-fixed smoothing parameters;
- rows dropped by
na.actionorsubset.
Rejected with an error:
- tensor, factor-smooth and multi-penalty terms;
- random effects with more than one variable, such as random slopes
s(g, x, bs = "re"); - other bases;
- other families and links;
- methods other than REML;
- non-default
gamma,scale,min.sp,HorparaPen; -
bam()andgamm()fits.
Before any deletion the package also checks that it can reproduce your fit, and stops if it cannot.
All results are conditional on the full-data representation. The model matrix, constraints and penalties of your fit are reused for every refit rather than rebuilt from the reduced data.
How it is checked
tests/testthat contains more than 400 expectations. They check that:
- the refits reproduce the original fit;
- the fixed refit reduces exactly to Cook’s distance for a linear model, and to it in the limit as a held smoothing parameter goes to zero;
- deletions match a closed form (Gaussian, smoothing parameters held) and ordinary
gam()refits (random-effect models); - the re-estimated refits are optimal under an independently coded REML criterion (Gaussian, Poisson, binomial);
- the package handles row alignment, rank deficiency after deletion, two REML optima, and out-of-scope models correctly.
Two scripts in validation/ print the numbers behind these checks. planted_site.R is a small known-truth simulation:
- One site with an extreme random effect was planted in each of 20 datasets.
- fixed never exceeded its null 99% line (0 of 20 datasets).
- added exceeded its null 99% line in 20 of 20.
Leaving the site out would also show up in the total change (18 of 20). What the package adds is where the influence comes from, not whether a site is influential.
Limitations
- For negative binomial models with covariate smooths, the re-estimated refit is checked for reproduction and convergence only. The independent reference covers random-effect-only negative binomial models.
- Two searches find the better of two REML optima, not necessarily the best overall.
- The planted-site check is one Gaussian design with one effect size.
- No null reference or p-values.